
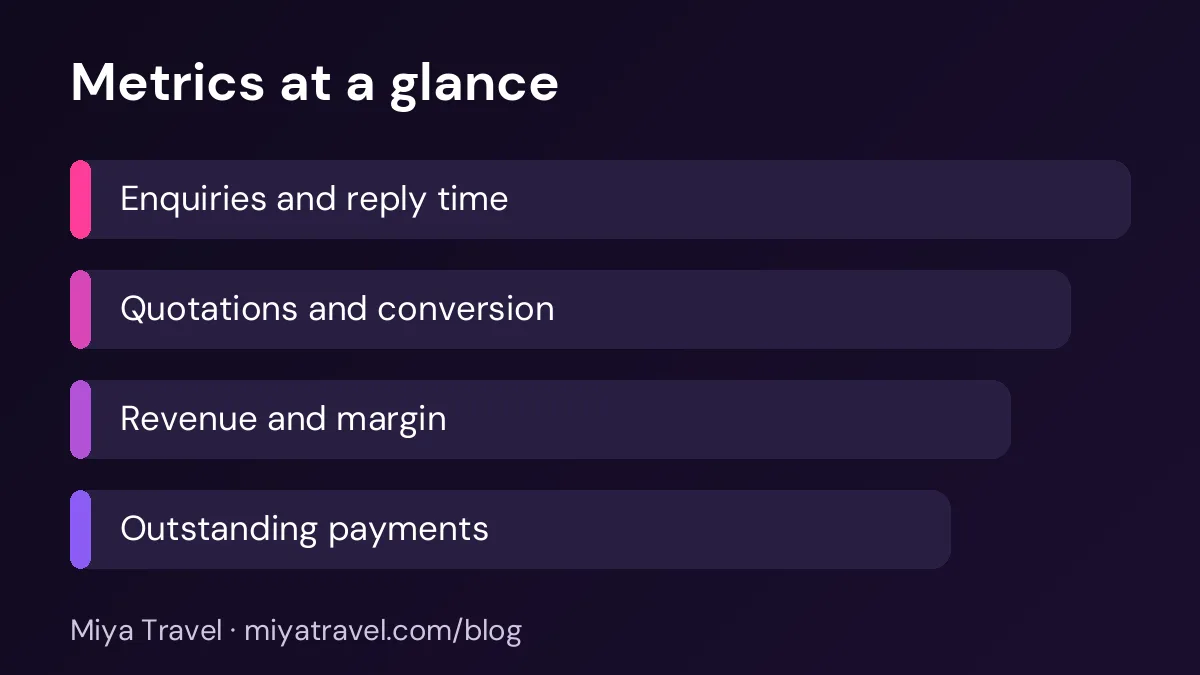
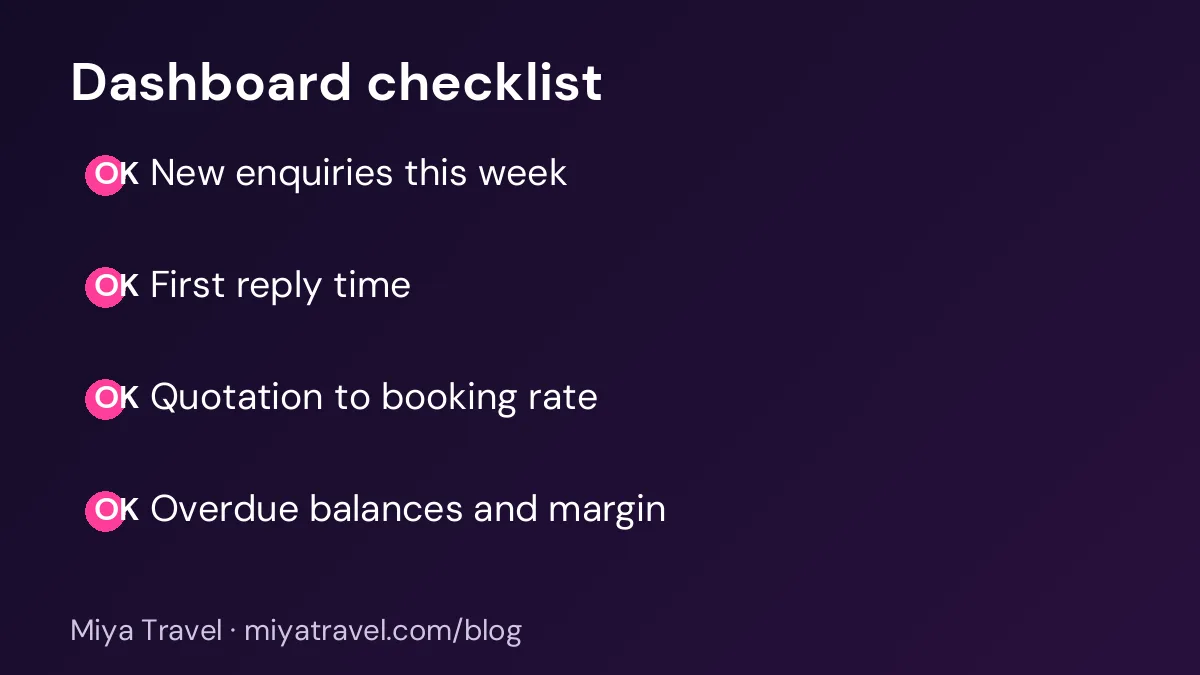
A travel agency dashboard should show a small set of metrics: new enquiries, first reply time, quotations sent, conversion to bookings, revenue, margin, outstanding payments and team activity. Each metric should lead to a specific decision, so the dashboard is a tool for action rather than decoration.
A dashboard is only useful if someone looks at it and acts on what it shows. Many travel agencies have a screen full of charts that nobody reads, while the real problems stay hidden in the lead list or the payment records. A good dashboard is short. It shows the few numbers that show the health of the business, and each one points to a decision. This guide explains which metrics to include, what each one tells you and what to do when it moves.
Keep the dashboard to a handful of metrics
Start with eight metrics at most. More than that and the team will skip the dashboard. The metrics should cover the whole sales journey, from the first enquiry to the cash in the bank. A useful set includes new enquiries, first reply time, quotations sent, conversion to bookings, revenue, margin, outstanding payments and team activity.
Each metric should have a target or a normal range, so the team can see when a number is off. A metric with no target is just a number, and numbers without targets rarely trigger action.
New enquiries and first reply time
New enquiries show how much demand the agency is generating. Track them weekly by source, so you can see which channel is growing or falling. A sudden drop may mean a broken website form, a paused advertisement or a seasonal dip.
First reply time shows how quickly the team responds. Track the average time from enquiry to first reply, and the percentage of enquiries answered within your target. If the reply time grows, the team may need more cover during busy hours or clearer ownership of leads.
Show the number of enquiries with no reply in the last 24 hours in red on the dashboard. This single number often drives more action than any other.
Quotations and conversion
Quotations sent shows how much the team is offering. Conversion to bookings shows how many of those offers turn into sales. A rising number of quotations with a falling conversion rate suggests the offer or the follow-up needs work. A stable conversion rate with fewer quotations suggests the enquiry stage is the bottleneck.
Track the conversion by package and by agent, not only as a total. The breakdown shows where the offer works and where coaching is needed.
Revenue and margin
Revenue shows the money from confirmed bookings in the period. Margin shows how much of that revenue is left after supplier costs and commissions. Track both. A month with high revenue and low margin can hide a problem, such as a supplier price rise that was not passed on to clients.
Review margin by package each month. If a package earns a low margin, decide whether to change the price, the supplier or the itinerary. Make the decision before the next season's bookings are confirmed.
Outstanding payments
Outstanding payments show the money owed to the agency. Track the total balance due, the amount overdue and the number of clients with overdue balances. These numbers link directly to cash flow. A large overdue balance can be more dangerous to the business than a small drop in sales.
Set a target for overdue balances, such as no more than a small percentage of monthly revenue. When the target is missed, decide who will chase the payments and by when.
Team activity
Team activity shows how the team spends its time. Track the number of calls, messages, quotations sent and follow-ups completed for each person. These numbers are for coaching, not for ranking. An agent with low activity may need help with the workload or the process, while an agent with high activity and low conversion may need help with the offer.
Keep team metrics private to the owner and the individual. A dashboard that shows public rankings can create unhealthy competition and discourage people who are new to the role.
Choosing the view for each person
Not everyone needs the same dashboard. The owner needs the whole picture. Each sales agent needs their own enquiries, follow-ups and quotations. The accounts person needs outstanding payments and invoices. Set up separate views, so each person sees the metrics that drive their work.
If your tool does not support separate views, a simple weekly email or printout with the relevant numbers for each role works well.
Turning metrics into decisions
Each metric should lead to a decision. A falling conversion rate leads to a review of the quotation and the follow-up. A rising overdue balance leads to a payment review. A slow reply time leads to a change in the rota. A margin drop leads to a package review.
Write the decision next to the metric when you review it. Assign an owner and a date. A dashboard that drives decisions is worth far more than one that only looks good.
Common mistakes
The first mistake is too many metrics. The second is no target, so no one knows whether a number is good or bad. The third is metrics that are not updated, which makes the dashboard untrustworthy. The fourth is no decision linked to each metric. The fifth is showing team rankings publicly.
Another mistake is measuring activity without outcomes. Calls and messages matter, but bookings and margin matter more. Balance activity measures with outcome measures.
Checking the data behind the dashboard
A dashboard is only as accurate as the data behind it. Check that leads are updated after each call, that bookings are confirmed in the system and that payments are recorded on the day they arrive. Once a month, compare the dashboard totals with your accounts. Any difference should be explained and fixed.
Building the dashboard step by step
Start with the owner's questions, not with the software. Write down the five questions you ask most often in a week, such as how many enquiries came in, how many quotations are waiting for a reply and how much money is due this month. Each question should map to one metric on the dashboard.
Next, decide the time period for each metric. Some numbers are best viewed weekly, such as enquiries and replies. Others work better monthly, such as margin by package. Mixing periods on one screen confuses people, so label each metric clearly with its period.
Then set the target for each metric. A target does not need to be perfect. For example, you might aim to reply to all enquiries within an hour during working hours, or to keep overdue balances below a set share of monthly revenue. Write the target next to the metric, so the team knows what good looks like.
Finally, test the dashboard for one full week before relying on it. Check each number against the source records, such as the lead list and the payment ledger. If a number does not match, find the cause and fix the data entry habit, not only the number on the screen.
Avoiding a dashboard nobody reads
Many dashboards fail because they are built once and never reviewed. Set a fixed time for the dashboard review, such as Monday morning, and make it part of the team routine. A dashboard that is opened only when a problem occurs will always be late.
Keep the layout stable. If the metrics move around every month, people spend time searching for numbers instead of acting on them. Use the same order, colours and labels for every review, so the team can spot changes quickly.
Ask each person which number they would like to see first. Often the answer is different for the owner, the sales agent and the accounts person. Give each person a small personal view with their own numbers at the top, and keep the full dashboard for the owner.
Review the metrics every quarter. Remove any number that no one uses, and add one that answers a new question. A dashboard should change as the business changes, otherwise it will measure the wrong things.
Frequently asked questions
How many metrics should a travel agency dashboard show?
Eight or fewer. Keep the dashboard focused on the metrics that drive decisions, and add more only when you need them.
How often should the dashboard be reviewed?
Check the key numbers daily or weekly, and review trends monthly. The owner should look at it at least once a week.
What is the most important metric for a travel agency?
It depends on your stage, but conversion from enquiry to booking and the overdue balance are two of the most useful in most agencies.
Should team activity be shown on the dashboard?
Show it privately to the owner and each person, as a coaching tool. Avoid public rankings, which can discourage the team.
What should I do when a metric goes off target?
Write the decision next to the metric, assign an owner and a date, and review the result at the next weekly meeting.